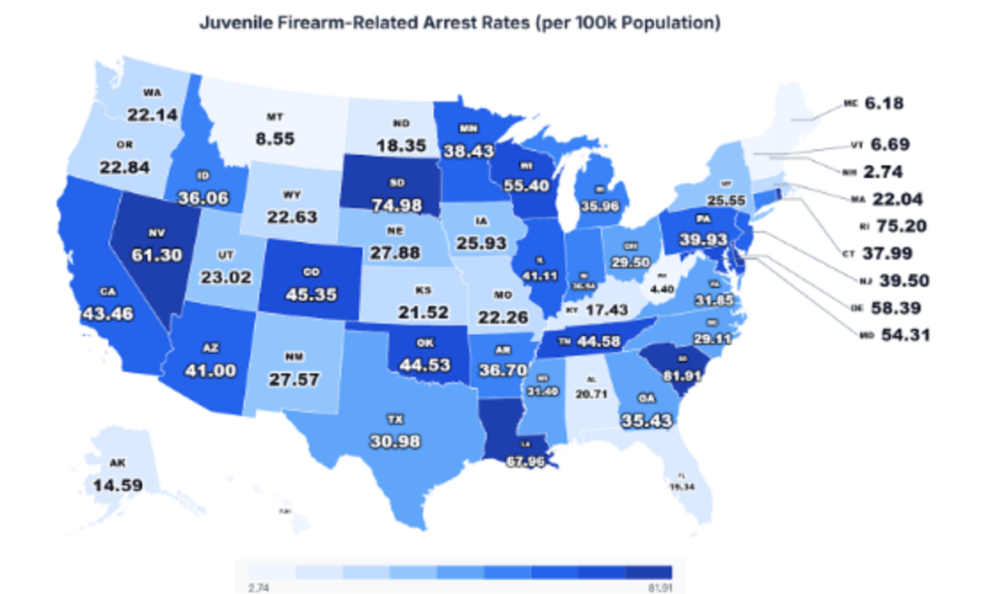
A 30-fold gap separates the highest and lowest juvenile firearm arrest rates in America. This disparity, spanning 2,889% between states, raises fundamental questions about how jurisdictions enforce weapons laws among minors aged 10-17.
The study conducted by Simmrin Law Group, analyzed arrest data from the FBI Crime Data Explorer, focusing on “Weapons: Carrying and Possession” offenses among juveniles aged 10-17 across all 50 U.S. states from 2021 to 2025. It calculates the average annual arrest rates per 100,000 youth population.
STATES WITH HIGHEST JUVENILE FIREARM ARREST RATES
Table 1: Top 10 States by Average Annual Arrest Rate per 100,000 Youth (2021–2025)
| Rank | State | Avg. Annual Arrests | Youth Population | Rate per 100K |
|---|---|---|---|---|
| 1 | South Carolina | 563 | 687,868 | 81.91 |
| 2 | Rhode Island | 100 | 132,983 | 75.20 |
| 3 | South Dakota | 96 | 127,774 | 74.98 |
| 4 | Louisiana | 419 | 616,862 | 67.96 |
| 5 | Nevada | 244 | 398,396 | 61.30 |
| 6 | Delaware | 74 | 126,053 | 58.39 |
| 7 | Wisconsin | 418 | 754,506 | 55.40 |
| 8 | Maryland | 428 | 788,419 | 54.31 |
| 9 | Colorado | 335 | 738,326 | 45.35 |
| 10 | Tennessee | 401 | 899,977 | 44.58 |
South Carolina records a rate nearly 30 times greater than New Hampshire, representing a 2,889% gap in juvenile firearm arrest rates nationwide. This top 10 spans multiple regions, indicating high arrest rates are not confined to any single geographic area.
STATES WITH LOWEST JUVENILE FIREARM ARREST RATES
Table 2: Bottom 10 States by Average Annual Arrest Rate per 100,000 Youth (2021–2025)
| Rank | State | Avg. Annual Arrests | Youth Population | Rate per 100K |
|---|---|---|---|---|
| 50 | New Hampshire | 4 | 160,673 | 2.74 |
| 49 | West Virginia | 10 | 218,319 | 4.40 |
| 48 | Maine | 9 | 148,923 | 6.18 |
| 47 | Vermont | 5 | 77,761 | 6.69 |
| 46 | Hawaii | 12 | 165,586 | 7.01 |
| 45 | Montana | 12 | 140,364 | 8.55 |
| 44 | Alaska | 14 | 98,698 | 14.59 |
| 43 | Kentucky | 103 | 592,105 | 17.43 |
| 42 | North Dakota | 20 | 106,826 | 18.35 |
| 41 | Florida | 500 | 2,586,768 | 19.34 |
Six states record rates below 10 per 100,000 youth, with New Hampshire averaging just 4.4 arrests annually, more than 500 times fewer than California. These low-rate states are geographically dispersed across New England, Appalachia, the Mountain West, and the Pacific.
STATES WITH LARGEST INCREASES IN JUVENILE FIREARM ARRESTS
Table 3: Top 10 States by Percentage Increase in Arrests (2021 vs. 2025)
| Rank | State | 2021 Arrests | 2025 Arrests | Change | % Increase |
|---|---|---|---|---|---|
| 1 | New York | 91 | 768 | +677 | +744% |
| 2 | California | 561 | 2,311 | +1,750 | +312% |
| 3 | Arizona | 111 | 427 | +316 | +285% |
| 4 | Illinois | 249 | 926 | +677 | +272% |
| 5 | Alaska | 5 | 15 | +10 | +200% |
| 6 | New Mexico | 35 | 100 | +65 | +186% |
| 7 | Maine | 4 | 11 | +7 | +175% |
| 8 | Vermont | 2 | 5 | +3 | +150% |
| 9 | Nebraska | 38 | 94 | +56 | +147% |
| 10 | Pennsylvania | 298 | 632 | +334 | +112% |
New York, with the steepest increase, recorded a 744% surge in juvenile firearm arrests over five years, climbing from 91 to 768 annually. California more than quadrupled its arrest counts, with the largest absolute increase adding 1,750 annual arrests.
STATES WITH LARGEST DECREASES IN JUVENILE FIREARM ARRESTS
Table 4: Top 10 States by Percentage Decrease in Arrests (2021 vs. 2025)
| Rank | State | 2021 Arrests | 2025 Arrests | Change | % Decrease |
|---|---|---|---|---|---|
| 1 | Hawaii | 8 | 3 | -5 | -63% |
| 2 | Louisiana | 416 | 235 | -181 | -44% |
| 3 | West Virginia | 11 | 7 | -4 | -36% |
| 4 | Indiana | 252 | 167 | -85 | -34% |
| 5 | South Dakota | 103 | 71 | -32 | -31% |
| 6 | Tennessee | 479 | 331 | -148 | -31% |
| 7 | Connecticut | 170 | 134 | -36 | -21% |
| 8 | North Dakota | 16 | 13 | -3 | -19% |
| 9 | South Carolina | 468 | 389 | -79 | -17% |
| 10 | Mississippi | 118 | 100 | -18 | -15% |
| 11 | Arkansas | 118 | 100 | -18 | -15% |
| 12 | Michigan | 458 | 391 | -67 | -15% |
| 13 | Kansas | 82 | 72 | -10 | -12% |
Thirteen states recorded double-digit percentage decreases in juvenile firearm arrests between 2021 and 2025, with the largest decline reaching 63%. Notably, South Carolina, with the highest national arrest rate, still saw a 17% decrease yet maintained its top ranking.
STATES WITH HIGHEST RAW VOLUME OF JUVENILE FIREARM ARRESTS
Table 5: Top 10 States by Average Annual Arrest Volume (2021–2025)
| Rank | State | Avg. Annual Arrests | Youth Population | Rate per 100K |
|---|---|---|---|---|
| 1 | California | 2,242 | 5,159,538 | 43.46 |
| 2 | Texas | 1,360 | 4,391,357 | 30.98 |
| 3 | Illinois | 668 | 1,625,037 | 41.11 |
| 4 | Pennsylvania | 645 | 1,615,848 | 39.93 |
| 5 | New York | 607 | 2,374,542 | 25.55 |
| 6 | South Carolina | 563 | 687,868 | 81.91 |
| 7 | Georgia | 542 | 1,529,769 | 35.43 |
| 8 | Florida | 500 | 2,586,768 | 19.34 |
| 9 | New Jersey | 464 | 1,175,052 | 39.50 |
| 10 | Michigan | 456 | 1,268,223 | 35.96 |
The top five states by volume account for more than 36% of all juvenile firearm arrests nationwide, averaging approximately 5,522 arrests annually. California averages 2,242 arrests per year, more than the combined totals of Texas and Illinois.
METHODOLOGY
The study examines arrest data from the FBI Crime Data Explorer for “Weapons: Carrying and Possession” offenses among juveniles aged 10-17 across all 50 U.S. states from 2021 through 2025. Average annual arrest rates were calculated by summing each state’s arrests across all five years, dividing by five, and then dividing by the state’s average youth population (ages 10-17) derived from U.S. Census Bureau estimates for 2021-2024, with 2025 figures extrapolated from existing trends. Rates are expressed per 100,000 youth population. Washington D.C. and U.S. territories were excluded due to data comparability considerations. Arrest data reflect law enforcement activity rather than underlying offense rates, reporting completeness varies by jurisdiction, and arrests do not indicate guilt or final case disposition.
DATA SOURCES
FBI Crime Data Explorer
U.S. Department of Justice, Federal Bureau of Investigation — https://cde.ucr.cjis.gov/LATEST/webapp/#/pages/explorer/crime/arrest
Research Datasheet: https://docs.google.com/spreadsheets/d/1_TEsq818qFDyYg6TuIYMvP6s7jFhe9wawfZSmD5Kwro/edit?usp=sharing
Study by: https://www.simmrinlawgroup.com
ABOUT SIMMRIN LAW GROUPSimmrin Law Group is a California-based criminal defense law firm specializing in weapons charges, juvenile defense, and firearms-related cases. The firm represents clients throughout the criminal justice process and conducts ongoing research into enforcement trends to better serve communities and inform public understanding of the legal system.
Add Comment