KEY HIGHLIGHTS
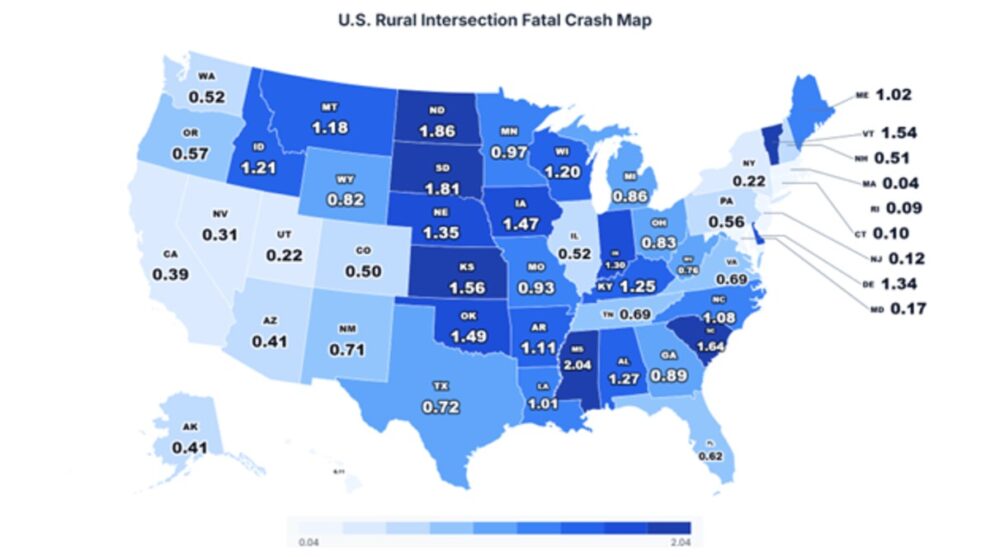
- Mississippi’s fatal rural intersection crash rate of 2.04 per 100,000 residents is nearly three times the national average of 0.70, making it the most dangerous state in America for drivers navigating country crossroads.
- Twenty states record a fatal rural intersection crash rate of 1.0 or higher per 100,000 residents, revealing that deadly crossings are not isolated incidents but a systemic, coast-to-coast pattern.
- 11,642 fatal crashes occurred at rural intersections from 2019 to 2023. Massachusetts’ rate of 0.04 and Mississippi’s rate of 2.04 mark a 51-to-1 state-to-state safety gap, the widest in the dataset.
Rural intersections are among the most deceptively dangerous points in America’s road network. Without traffic signals, limited sight lines, and high approach speeds, a single missed stop sign at a country crossroad can turn fatal in seconds. A new five-year analysis of federal crash data reveals exactly where that risk is greatest, and the results may surprise you.
According to an analysis by Grigor Law Injury & Car Accident Lawyers, the study used the Fatality Analysis Reporting System (FARS), accessed via NHTSA’s CDAN query tool, filtering for fatal motor vehicle crashes at rural intersections across all 50 states from 2019 to 2023. Crash counts were averaged annually and normalized per 100,000 state residents to allow fair comparison across states of different sizes.
Mississippi Records the Nation’s Highest Fatal Rural Intersection Crash Rate at 2.04 Per 100,000 Residents
| Rank | State | Population (2023) | Avg. Annual Fatal Crashes (2019–2023) | Rate per 100K Residents |
| 1 | Mississippi | 2,939,690 | 60.0 | 2.04 |
| 2 | North Dakota | 783,926 | 14.6 | 1.86 |
| 3 | South Dakota | 919,318 | 16.6 | 1.81 |
| 4 | South Carolina | 5,373,555 | 88.2 | 1.64 |
| 5 | Kansas | 2,940,546 | 45.8 | 1.56 |
| 6 | Vermont | 647,464 | 10.0 | 1.54 |
| 7 | Oklahoma | 4,053,824 | 60.6 | 1.49 |
| 8 | Iowa | 3,207,004 | 47.2 | 1.47 |
| 9 | Nebraska | 1,978,379 | 26.8 | 1.35 |
| 10 | Delaware | 1,031,890 | 13.8 | 1.34 |
Mississippi anchors the ranking with a rate of 2.04 fatal rural intersection crashes per 100,000 residents, nearly three times the national average of 0.70. North Dakota (1.86) and South Dakota (1.81) follow closely, with the top three states all posting rates more than 2.5 times the national benchmark. Nine of the top ten states have populations under 5 million, suggesting that lower-population states with expansive rural road networks face disproportionate intersection danger.
Looking at the study, Chrissy Grigoropoulos, founding partner at Grigor Law Injury & Car Accident Lawyers, commented:
“The 51-to-1 gap between Mississippi and Massachusetts is staggering. It tells us that where you live, and where you drive, can determine whether a routine turn through a rural intersection is safe or deadly. These numbers should drive urgent investment in signage, sight-line improvements, and intersection redesign in the hardest-hit states.”
Texas and California Account for 15.9% of All Fatal Rural Intersection Crashes Nationally
| Rank | State | Avg. Annual Fatal Crashes (2019–2023) | Population (2023) | Rate per 100K | Danger Rank |
| 1 | Texas | 220.8 | 30,503,301 | 0.72 | 28 |
| 2 | California | 150.4 | 38,965,193 | 0.39 | 41 |
| 3 | Florida | 140.8 | 22,610,726 | 0.62 | 32 |
| 4 | North Carolina | 117.4 | 10,835,491 | 1.08 | 18 |
| 5 | Georgia | 98.4 | 11,029,227 | 0.89 | 23 |
| 6 | Ohio | 98.0 | 11,785,935 | 0.83 | 25 |
| 7 | Indiana | 89.2 | 6,862,199 | 1.30 | 11 |
| 8 | South Carolina | 88.2 | 5,373,555 | 1.64 | 4 |
| 9 | Michigan | 86.2 | 10,037,261 | 0.86 | 24 |
| 10 | Pennsylvania | 72.4 | 12,961,683 | 0.56 | 34 |
Texas and California recorded a combined 371.2 average annual fatal rural intersection crashes, representing 15.9% of the national total, yet rank only 28th and 41st respectively by per-capita rate. South Carolina is the only state appearing in both this table and the top 10 by rate, underscoring that high-volume and high-rate dangers do not always overlap. The top 10 states by crash volume account for nearly half (49.9%) of all fatal rural intersection crashes nationwide.
Massachusetts Posts the Lowest Fatal Rural Intersection Crash Rate in the Nation at 0.04 Per 100,000 Residents
| Rank | State | Population (2023) | Avg. Annual Fatal Crashes (2019–2023) | Rate per 100K Residents |
| 46 | New Jersey | 9,290,841 | 10.8 | 0.12 |
| 47 | Hawaii | 1,435,138 | 1.6 | 0.11 |
| 48 | Connecticut | 3,617,176 | 3.6 | 0.10 |
| 49 | Rhode Island | 1,095,962 | 1.0 | 0.09 |
| 50 | Massachusetts | 7,001,399 | 3.0 | 0.04 |
Massachusetts’ rate of 0.04 per 100,000 is 51 times lower than Mississippi’s, the widest gap in the dataset. The five safest states tend to have denser populations, shorter rural road networks, and more signalized intersections. New Jersey (0.12) and Connecticut (0.10) demonstrate how compact, high-traffic states with well-managed rural corridors dramatically reduce fatal intersection risk.
Twenty States Record a Fatal Rural Intersection Crash Rate of 1.0 or Higher Per 100,000 Residents
| Rank | State | Population (2023) | Avg. Annual Fatal Crashes | Rate per 100K |
| 1 | Mississippi | 2,939,690 | 60.0 | 2.04 |
| 2 | North Dakota | 783,926 | 14.6 | 1.86 |
| 3 | South Dakota | 919,318 | 16.6 | 1.81 |
| 4 | South Carolina | 5,373,555 | 88.2 | 1.64 |
| 5 | Kansas | 2,940,546 | 45.8 | 1.56 |
| 6 | Vermont | 647,464 | 10.0 | 1.54 |
| 7 | Oklahoma | 4,053,824 | 60.6 | 1.49 |
| 8 | Iowa | 3,207,004 | 47.2 | 1.47 |
| 9 | Nebraska | 1,978,379 | 26.8 | 1.35 |
| 10 | Delaware | 1,031,890 | 13.8 | 1.34 |
| 11 | Indiana | 6,862,199 | 89.2 | 1.30 |
| 12 | Alabama | 5,108,468 | 65.0 | 1.27 |
| 13 | Kentucky | 4,526,154 | 56.8 | 1.25 |
| 14 | Idaho | 1,964,726 | 23.8 | 1.21 |
| 15 | Wisconsin | 5,910,955 | 71.0 | 1.20 |
| 16 | Montana | 1,132,812 | 13.4 | 1.18 |
| 17 | Arkansas | 3,067,732 | 34.2 | 1.11 |
| 18 | North Carolina | 10,835,491 | 117.4 | 1.08 |
| 19 | Maine | 1,395,722 | 14.2 | 1.02 |
| 20 | Louisiana | 4,573,749 | 46.0 | 1.01 |
Forty percent of U.S. states exceed a fatal rural intersection crash rate of 1.0 per 100,000 residents. The list spans every region of the country, from the Deep South (Mississippi, Alabama, Louisiana) to the Midwest (Iowa, Kansas, Nebraska) and New England (Vermont, Maine). Eight of these twenty states have populations under 2 million, reinforcing that small, rural states carry outsized per-capita risk at their crossroads.
Eight States With Populations Under 2 Million Record Fatal Rural Intersection Crash Rates Above 1.0 Per 100,000
| Rank | State | Population (2023) | Avg. Annual Fatal Crashes | Rate per 100K |
| 2 | North Dakota | 783,926 | 14.6 | 1.86 |
| 3 | South Dakota | 919,318 | 16.6 | 1.81 |
| 6 | Vermont | 647,464 | 10.0 | 1.54 |
| 9 | Nebraska | 1,978,379 | 26.8 | 1.35 |
| 10 | Delaware | 1,031,890 | 13.8 | 1.34 |
| 14 | Idaho | 1,964,726 | 23.8 | 1.21 |
| 16 | Montana | 1,132,812 | 13.4 | 1.18 |
| 19 | Maine | 1,395,722 | 14.2 | 1.02 |
These eight states share a common profile: small populations, expansive rural road networks, and limited intersection infrastructure. Vermont’s inclusion at a rate of 1.54 challenges the assumption that rural intersection danger is confined to the South or Plains states. Delaware, the smallest state on this list by area, still records a rate of 1.34, nearly double the national average, indicating that even compact states can harbor dangerous rural crossings.
Methodology
The study analyzed data from 2019 to 2023 using the Fatality Analysis Reporting System (FARS), accessed via NHTSA’s CDAN query tool. Only motor vehicle crashes at rural intersections resulting in at least one fatality were included. Annual crash averages were divided by 2023 state population estimates to produce a rate per 100,000 residents, enabling fair comparison across states with different population sizes.
Data Sources
- NHTSA CDAN Query Tool: https://cdan.dot.gov/query
- Research Dataset: https://docs.google.com/spreadsheets/d/1BP1azrxplCUwOfbF6bQxjLNAhdbJZ-KXS-heTn10u8U/edit?gid=0#gid=0
- Research by: https://grigorlaw.com/
About Grigor Law Injury & Car Accident Lawyers
The study was conducted by Grigor Law Injury & Car Accident Lawyers, a premier New York “all injury” law firm representing clients in personal injury, car accidents, workers’ compensation, and no-fault claims.
Add Comment