Key Takeaways
- U.S. EV sales reached 1,520,630 in 2024, a 5.15× increase since 2020, yet enclosed shipping, now recommended for EVs due to battery sensitivity, costs 30–60% more than standard open transport, and enclosed bookings rose 27% since 2022.
- Two major U.S. ocean carriers, Matson and TOTE Maritime Alaska, suspended EV shipping entirely in mid-2025 after three car carrier fires destroyed or damaged approximately 10,900 vehicles and caused an estimated $1.8 billion in combined losses.
- Google search interest for “EV shipping” surged 27× from 2021 to 2025, hitting peak levels after the Morning Midas sank in June 2025 with an estimated $559 million in total economic losses.
Every year, more Americans buy electric vehicles, 1.5 million in 2024 alone. But as EV adoption crosses into double-digit market share, a parallel crisis is escalating: shipping these cars is becoming harder, costlier, and in some cases, impossible.
A study conducted by RoadRunner Auto Transport analyzed IEA Global EV sales data (2010–2024), Google Trends search interest (March 2021–February 2026), published industry shipping rates, carrier policy changes, and maritime incident records to assess the escalating cost and complexity of shipping electric vehicles in the United States.
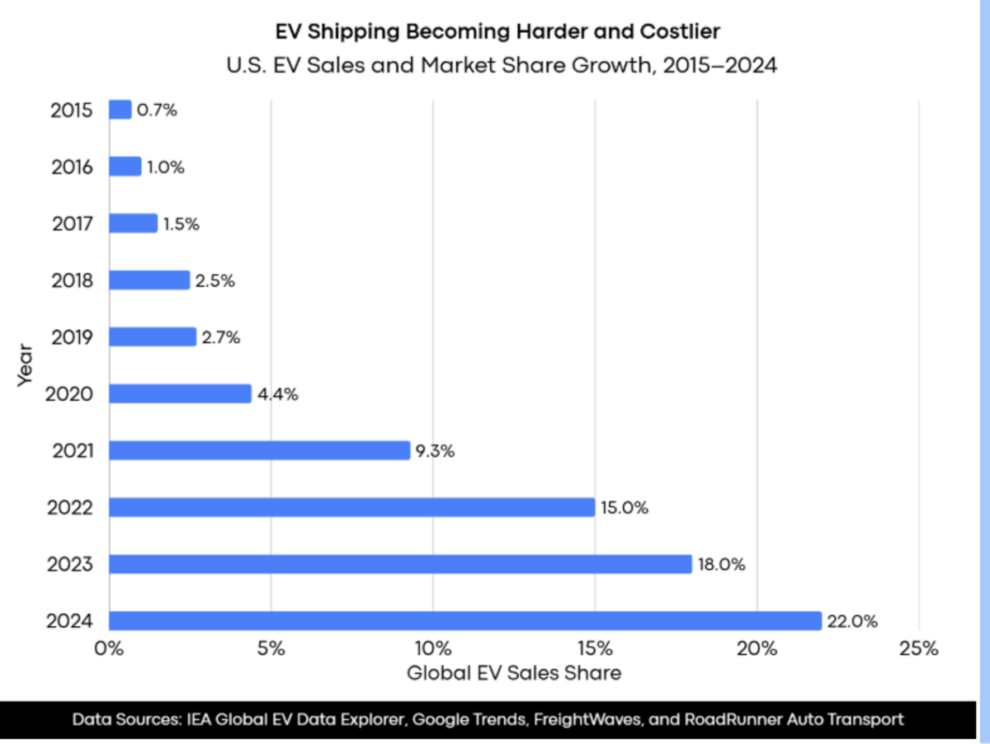
U.S. EV Sales and Market Share Growth, 2015–2024
| # | Year | Total EV Sales | US EV Sales Share | Global EV Sales Share | Year-Over-Year Growth |
| 1 | 2015 | 114,100 | 0.7% | 0.7% | –3.4% |
| 2 | 2016 | 161,100 | 1.0% | 1.0% | +41.2% |
| 3 | 2017 | 196,300 | 1.3% | 1.5% | +21.8% |
| 4 | 2018 | 362,700 | 2.3% | 2.5% | +84.8% |
| 5 | 2019 | 327,000 | 2.1% | 2.7% | –9.8% |
| 6 | 2020 | 295,200 | 2.3% | 4.4% | –9.7% |
| 7 | 2021 | 633,100 | 4.7% | 9.3% | +114.5% |
| 8 | 2022 | 992,700 | 7.4% | 15.0% | +56.8% |
| 9 | 2023 | 1,393,000 | 9.5% | 18.0% | +40.3% |
| 10 | 2024 | 1,520,630 | 10.0% | 22.0% | +9.2% |
U.S. EV sales grew more than 13× over the past decade, rising from 114,100 vehicles in 2015 to 1,520,630 in 2024, when EVs captured 10.0% of the U.S. car market. Globally, electric vehicles now account for 22.0% of all car sales. The steepest single-year surge came in 2021, when sales jumped 114.5% year-over-year to 633,100 units, catalyzed by new model launches, federal incentives, and shifting consumer preferences.
Three Major Car Carrier Fires Involving EVs (2022–2025)
| Date | Incident | Total Vehicles | EVs / Hybrids Aboard | Est. Economic Loss |
| Feb 2022 | Felicity Ace fire & sinking | 3,965 | Included VW ID.4 & Audi e-tron EVs | $334–$401M |
| Jul 2023 | Fremantle Highway fire | 3,783 | 498 EVs/hybrids (all recovered) | Ship sold €11M |
| Jun 2025 | Morning Midas fire & sinking | ~3,159 | ~750 electrified (65–70 EVs, 681+ hybrids) | $559M (est.) |
| TOTAL | 3 incidents (2022–2025) | ~10,907 | — | ~$1.8B combined |
Three high-profile car carrier fires between 2022 and 2025 destroyed approximately 10,900 vehicles and caused an estimated $1.8 billion in combined economic losses, according to preliminary figures from Anderson Economic Group. The most recent, the Morning Midas, sank in June 2025 carrying roughly 3,159 vehicles, including approximately 65-70 fully electric and 681+ hybrid vehicles, at an estimated total cost of $559 million. Fire cause in all three incidents remains officially unconfirmed.
Carrier EV Shipping Restrictions
| Carrier | Action | Effective Date | Scope |
| Matson Navigation | Suspended all EV, PHEV, and LFP battery shipments | Jul 14, 2025 | All routes: Hawaii, Alaska, Guam, Micronesia, US West Coast, China–SoCal |
| TOTE Maritime Alaska | Phased suspension of EVs, PHEVs, and lithium-ion battery machinery | Jun 29 – Aug 3, 2025 | All Alaska routes (Tacoma–Anchorage) |
| Multiple RoRo carriers | Most restrict or reject EVs for RoRo; require container + Class 9 hazmat | Ongoing | International ocean shipping under IMDG Code |
| Pasha Hawaii | Continues to accept EVs (competitor advantage) | Ongoing (as of Jul 2025) | Hawaii routes via enclosed PCTC vessel |
In the wake of these incidents, Matson Navigation suspended all EV, PHEV, and LFP battery shipments across every route on July 14, 2025, while TOTE Maritime Alaska began a phased suspension starting June 29, 2025. Pasha Hawaii remains the only major Hawaii-serving carrier that continues to accept EVs, creating a de facto near-monopoly on electric vehicle shipping to Hawaii. Internationally, most Roll-on/Roll-off carriers now classify EVs as Class 9 hazardous cargo under the IMDG Code, adding $250–$500 in surcharges per vehicle.
Consumer Search Interest: EV Shipping Terms Surge Up to 27× (2021–2025)
| Search Term | Avg 2021 | Avg 2022 | Avg 2023 | Avg 2024 | Avg 2025 | Growth (2021–2025) |
| “EV shipping” | 1.1 | 3.4 | 3.8 | 4.8 | 31.2 | 27.3× |
| “electric car transport” | 4.3 | 8.1 | 8.7 | 9.8 | 30.0 | 6.0× |
| “ship electric car” | 11.8 | 34.7 | 29.1 | 26.6 | 42.2 | 2.6× |
| “car shipping” (baseline) | 41.4 | 40.9 | 36.7 | 39.7 | 61.1 | 0.48× |
Google search interest for EV-specific shipping terms spiked dramatically in 2025, with “EV shipping” growing 27.3× from its 2021 average. All three EV shipping terms surged beginning in June–July 2025, coinciding with the Morning Midas sinking and Matson’s shipping ban, and peaked in November 2025–January 2026. By comparison, the general “car shipping” baseline grew only 0.48× over the same period, confirming the surge is EV-specific, not a broad shipping trend.
The EV Shipping Premium: What It Costs to Ship an Electric Vehicle
| Cost Factor | Figure | Source |
| Enclosed vs. open transport premium | 30–60% more than open transport | FreightWaves Checkpoint (Jan 2026) |
| Enclosed cost per mile (2025) | $1.30–$2.10/mile | Direct Connect Auto Transport (Aug 2025) |
| Enclosed bookings growth since 2022 | +27%, driven by newer EV models | Direct Connect Auto Transport survey |
| International EV hazmat surcharge | $250/vehicle or $500/container | West Coast Shipping (May 2023) |
| Maritime insurance premiums | Rising; insurers reassessing EV vessel risk | Allianz Commercial (Jun 2025) |
Enclosed car shipping, recommended for EVs due to battery sensitivity, typically costs 30–60% more than open transport, according to FreightWaves and multiple industry sources. In dollar terms, enclosed rates run $1.30–$2.10 per mile in 2025. Enclosed trailer bookings rose 27% compared to 2022, driven particularly by newer EV models with sensitive battery systems, according to an industry survey by Direct Connect Auto Transport.
Methodology
U.S. and global EV sales figures (2010–2024) and market share percentages were sourced from the IEA Global EV Data Explorer 2025, covering “Cars” mode only across BEV, PHEV, and FCEV powertrains. Monthly Google Trends data for four shipping-related terms was analyzed for the U.S. from March 2021 through February 2026. Shipping cost data was cross-referenced from five industry sources. Carrier restrictions and incident data were verified through official notices, operator statements, and named industry publications.
Data Sources
IEA Global EV Data Explorer 2025
https://www.iea.org/data-and-statistics/data-tools/global-ev-data-explorer
Google Trends, U.S. Search Interest Data
https://trends.google.com/trends/
FreightWaves Checkpoint (Shipping Cost Data)
https://www.freightwaves.com/checkpoint/open-vs-enclosed-car-shipping/
Research Dataset:
Study By:
https://www.roadrunnerautotransport.com/
About RoadRunner Auto Transport
RoadRunner Auto Transport is a leading nationwide vehicle shipping provider, connecting customers with a network of over 25,000 certified carriers. Specializing in safe, reliable transport for cars, SUVs, and trucks, RoadRunner leverages data-driven logistics to navigate complex routes, including severe winter conditions, to ensure every vehicle arrives safely.
Add Comment